


Power BI Desktop is composed of four editors:
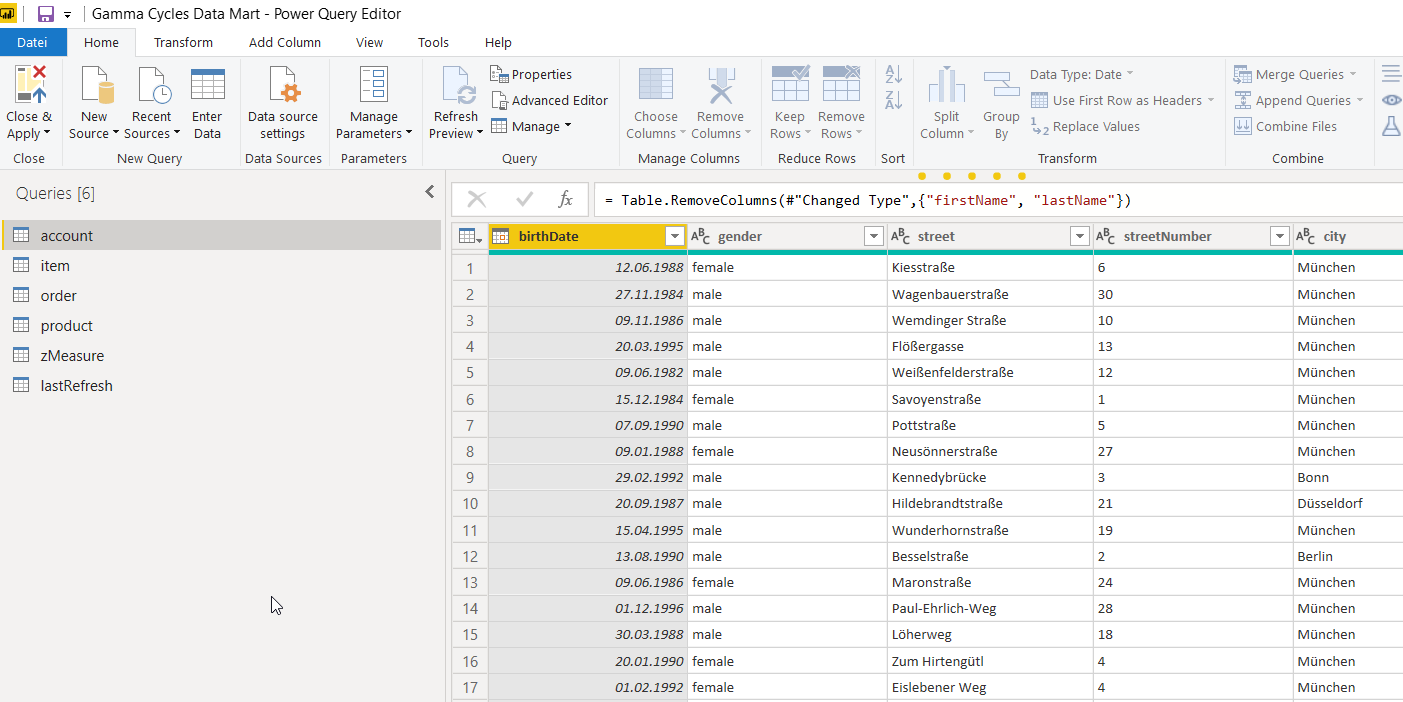
Power Query
Wirh Power Query Editor, you will extract, transform and load (ETL) your data. The Power Query editor is an add-in of Power BI Desktop which allows users to gather data from different sources such as Excel tables, databases and websites.
The language behind Power Query’s functions is M (I know, very creative). To access Power Query from Power BI Desktop, select Home > Transform Data.
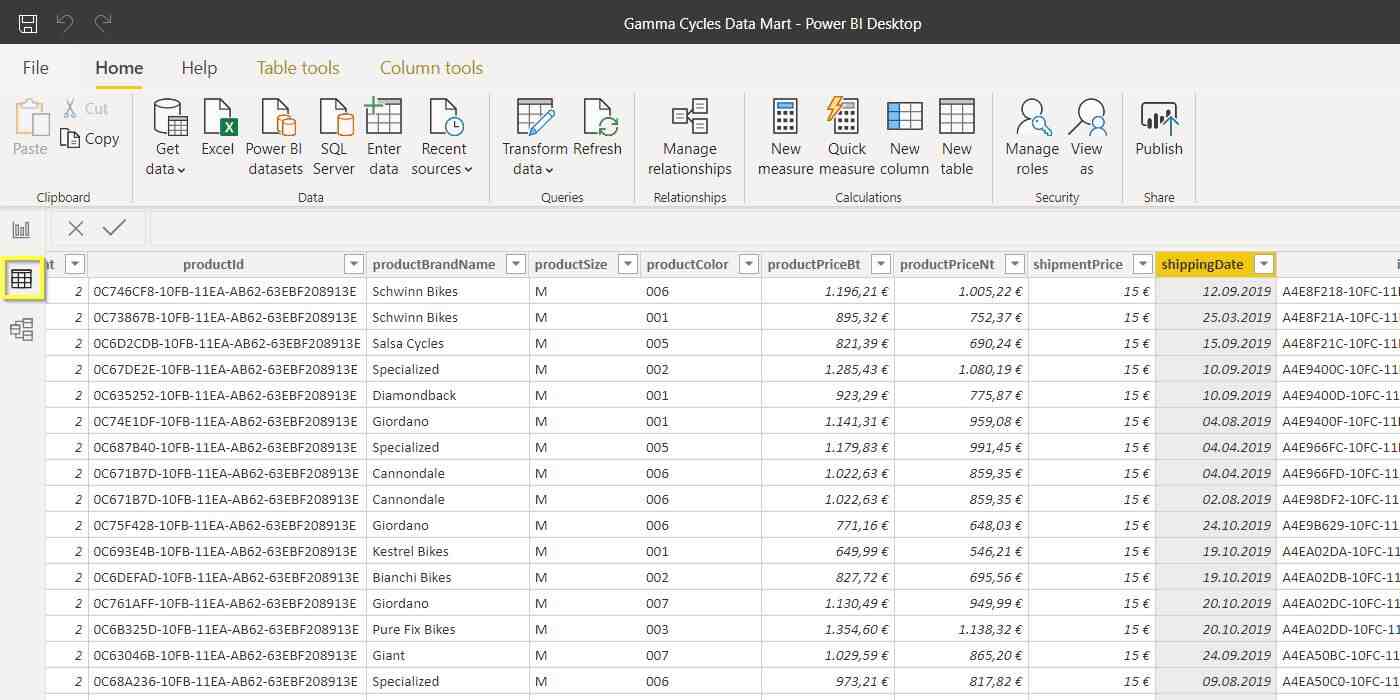
Data
With Data Editor, the user assigns the final formats to the different columns and tables. Also, the user is able to create new tables and columns, using either pane tools or DAX code. Data resembles Excel tables, both in appearance and in functionality.
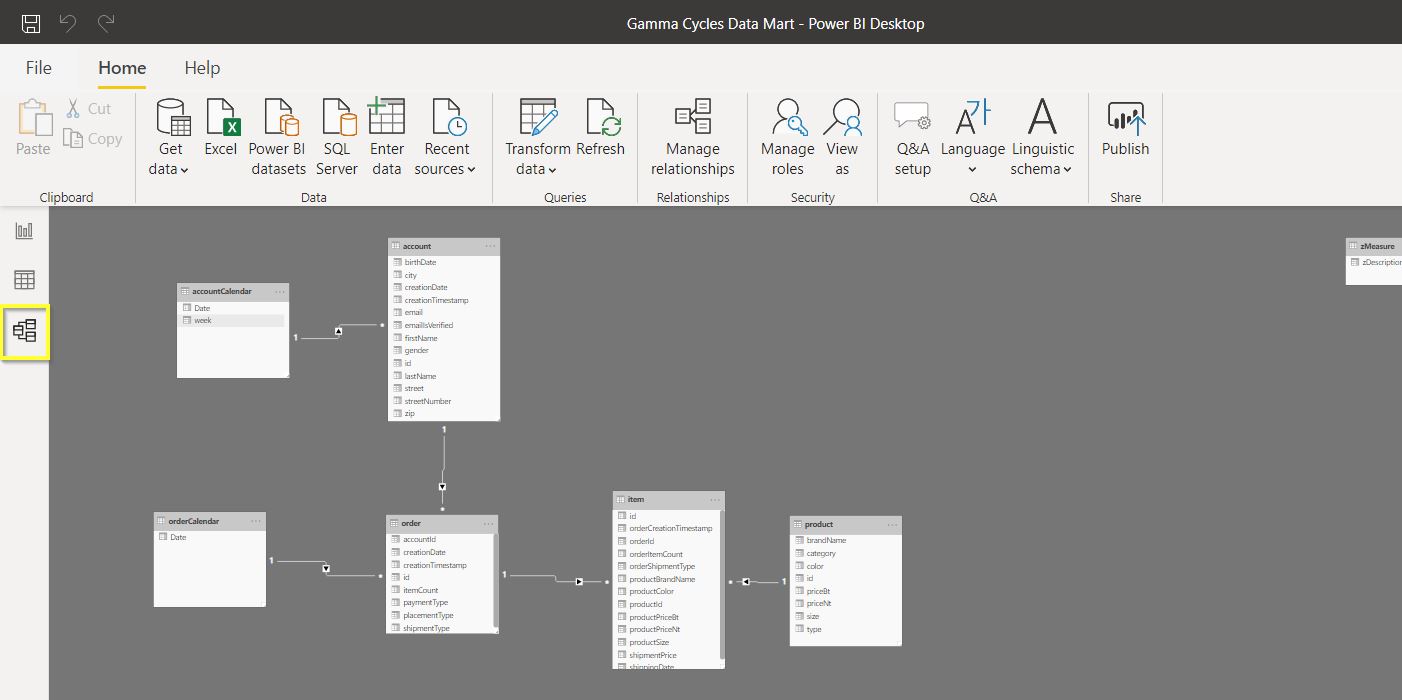
Model
With Model Editor, the user creates relations among tables. Modeling data is a crucial aspect, not only within Power BI but also within Business Intelligence as a field. Model gives you the ability to link tables using drag-and-drop tools.
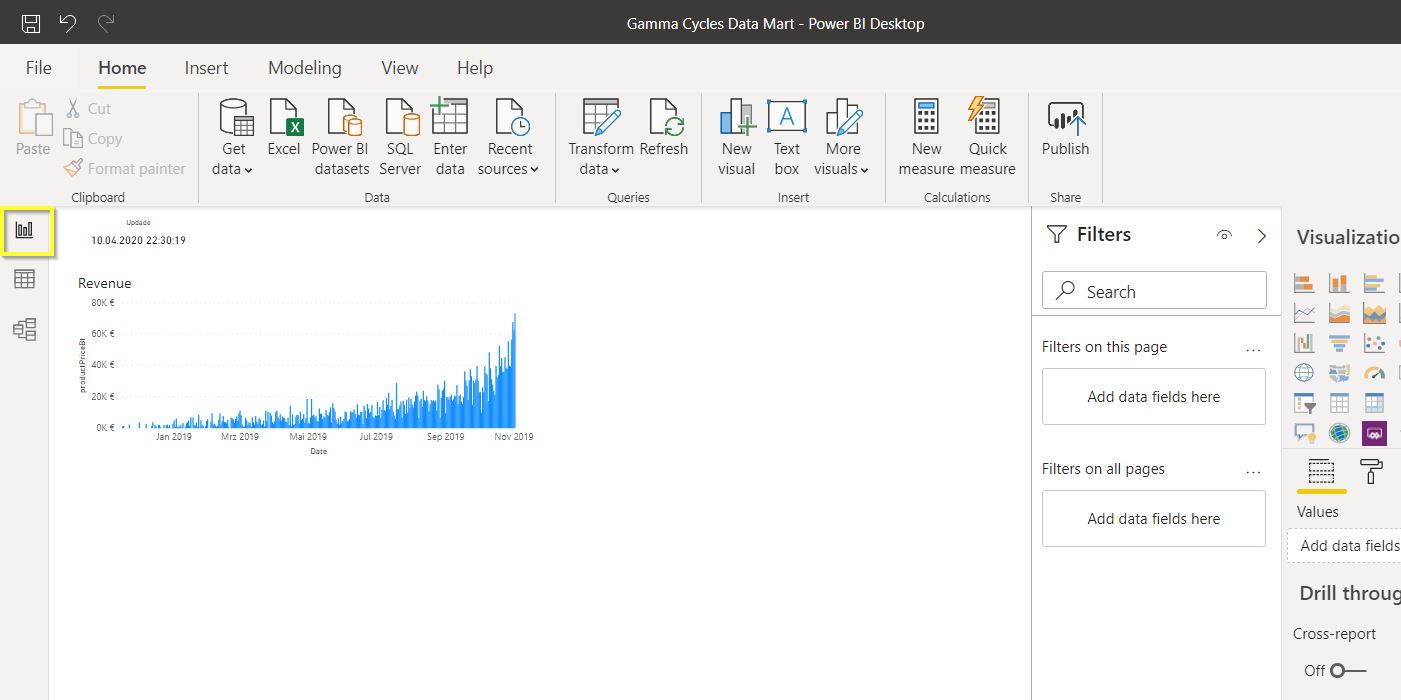
Report
Once you have loaded and organized your data, it is time to visualize it. With the Report Editor, the user is able to transform data into insights via a large selection of visualization tools.
In Visualization, the user is able to create measures, design a report’s background and set up filters, among other features.
Most of the posts in this blog series will reference these four editors frequently.


