


In Nudge, economist Richard Thaler promotes the practice of libertarian paternalism in society. By this idea, a choice architect designs ways to “nudge” others towards optimal decision-making.
We would argue that, we, the creators of data products, are also choice architects. We are responsible for sharing data and insights in ways which are most practical to the end user. And thus, it is also our duty to nudge the end user to make good use of the data and insights given to them.
The Use Case
A frequent use case of ours in Power BI (PBI) reports is table visuals listing information. The user would first apply filters to the table, and then export the resulting list into an excel file. This file would likely end up on the inbox of, let’s say, an external partner later on.
As choice architects, we provide the user with the information they need in PBI. But how do we nudge the user to export exactly the information they need? The idea is to make them apply filters before they are able to see any data.
Make the User Filter First
Let us create a sample PBI report using the GCSE exam scores dataset from the mlmRev package in R. The dataset is available here.
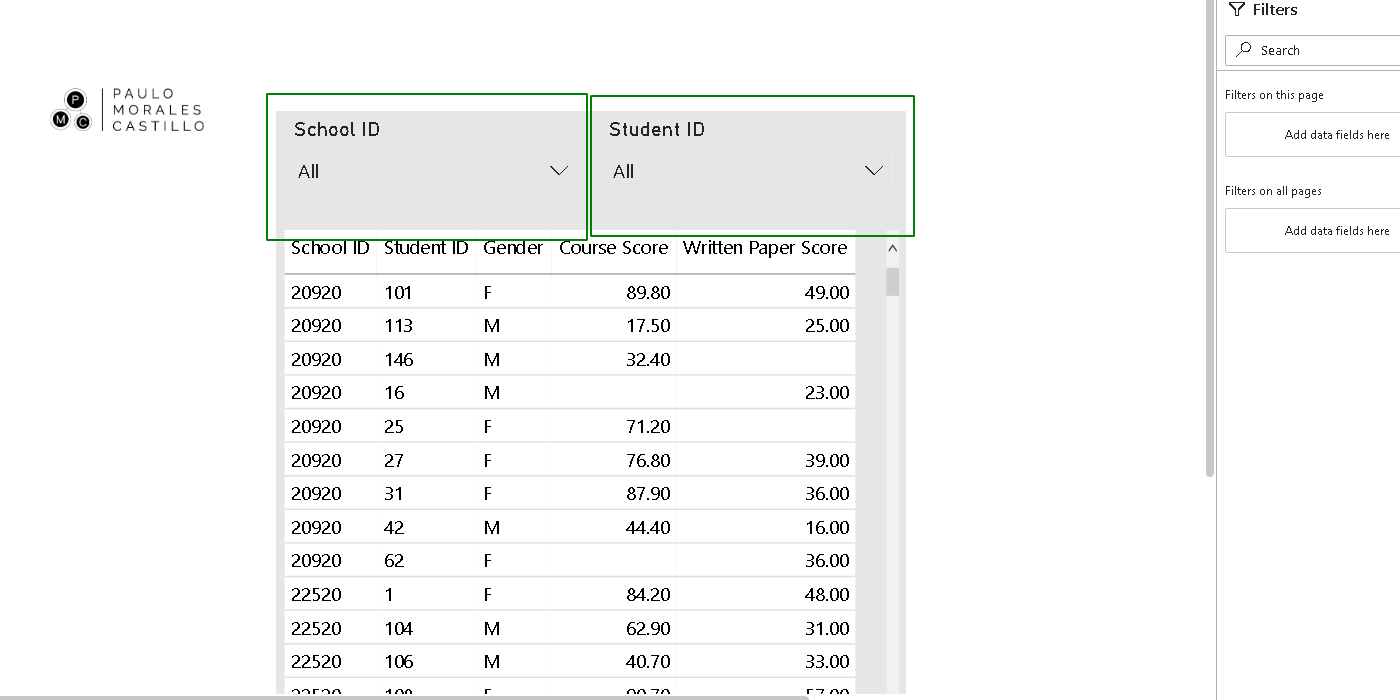
In this report, we provide the user with a table listing students’ scores per school. The report includes a filter for school ID and a filter for student ID.
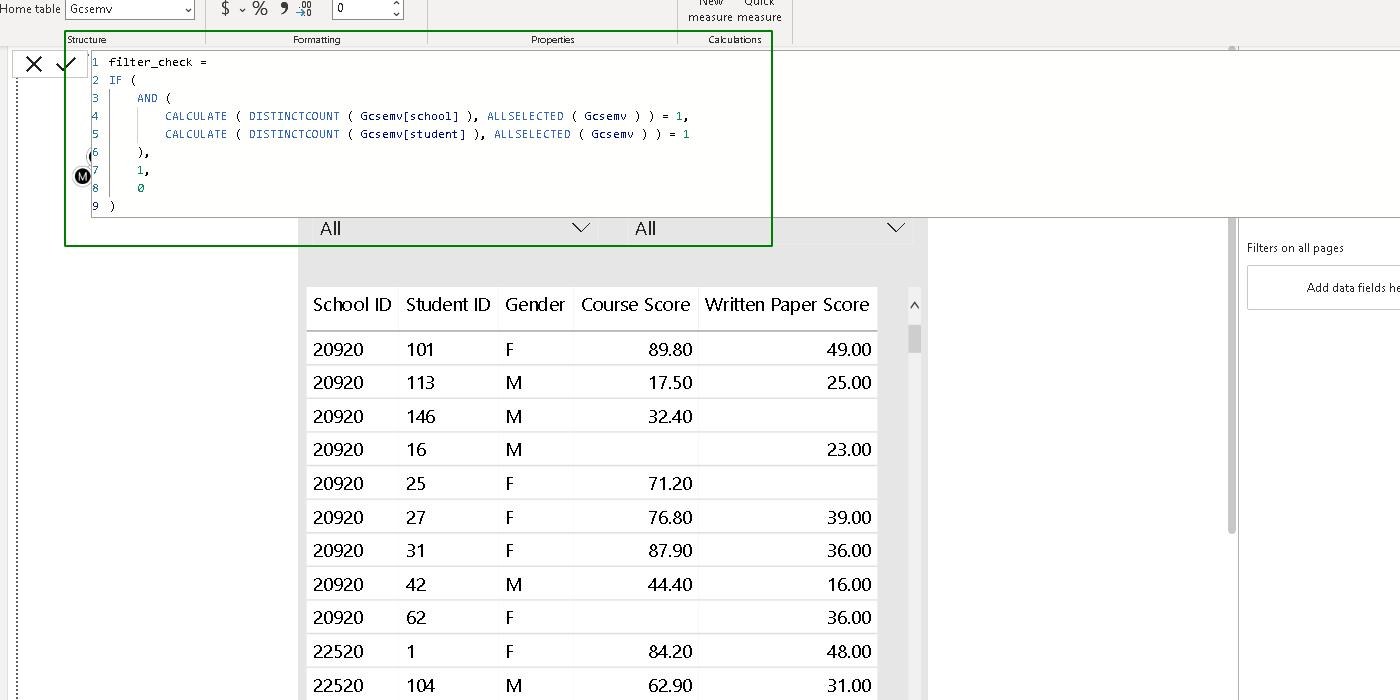
Next, using DAX, we create a measure called filter_check. The goal of this measure is to return 1 if both an specific school ID and an specific student ID are chosen in filters, 0 otherwise.
filter_check =
IF (
    AND (
        CALCULATE ( DISTINCTCOUNT ( Gcsemv[school] ), ALLSELECTED ( Gcsemv ) ) = 1,
        CALCULATE ( DISTINCTCOUNT ( Gcsemv[student] ), ALLSELECTED ( Gcsemv ) ) = 1
    ),
    1,
    0
)
To create filter_check in the report, go to Modeling>New Measure. In the header bar, insert the above DAX code and press enter.
Right after, use filter_check as a filter on the table visual. Begin by clicking on the table visual, and add filter_check as a table filter. Then, select the condition is greater than 0, and click on Apply filter.
Given that neither a school ID nor a student ID has been chosen in filters, filter_check is equal to 0. Thus, the table shows no information.
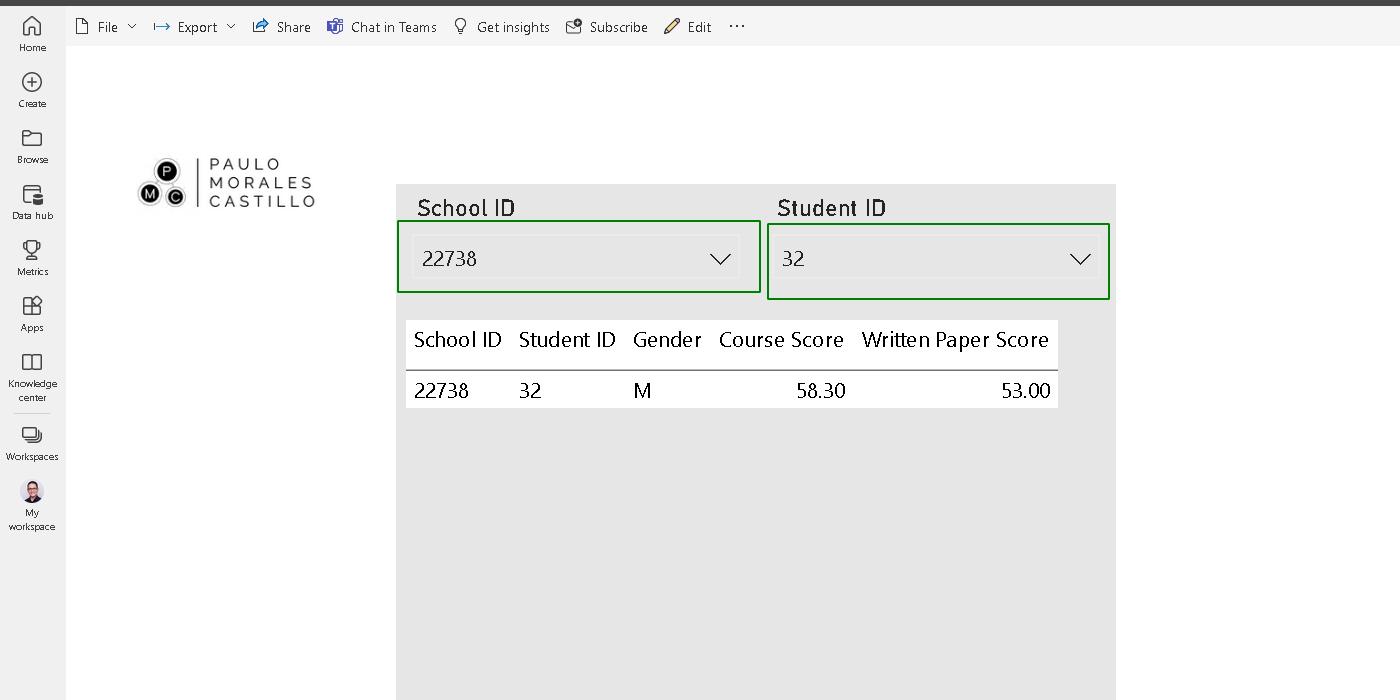
Finally, test this approach by choosing both school and student IDs. Notice that, normally, choosing only one of the two filters will render no results. Unless, of course, there is no more than one unique student ID per School and vice versa.
There are many versions of filter_check, depending on the report’s requirements. For example, this measure can be change to require either a school ID or student ID. It can also allow for many school and student IDs.
The sample report is available in Github.


