


As a Christmas gift, I wanted to give my relatives a minimalist map poster of the places where they live. A poster they could frame and put on the wall. I found a couple of websites that would do the mapping, printing and shipping but it was too expensive in my opinion. So I started looking for ways of plotting maps with a minimalist theme in R.
At first, I came across the package ggmap. With the function get_stamenmap(), the package enables you to use map tiles from services like Google Maps and Stamen Maps. The maps come as monochromatic images, which is a good minimalist theme. Yet the map styles available limit your ability to e.g. set the thickness of lines within the maps. This is not a surprise, as the tile themselves are images rather than a plot rendered in R.
Finally, I came across this tutorial. In this short guide, the author explains how to use the OpenStreetMaps (OSM) data package to create maps with ggplot. I invite you to go through the tutorial should you want to know more about using OSM data in R.
The biggest issue I run into with the OSM data is the coordinates themselves. With the function getbb(), you are able to find the bounding coordinates of a location (city, country, etc). The issue is that, when plotting a location with the bounding coordinates on a common poster-size pdf, a lot of white space is created.
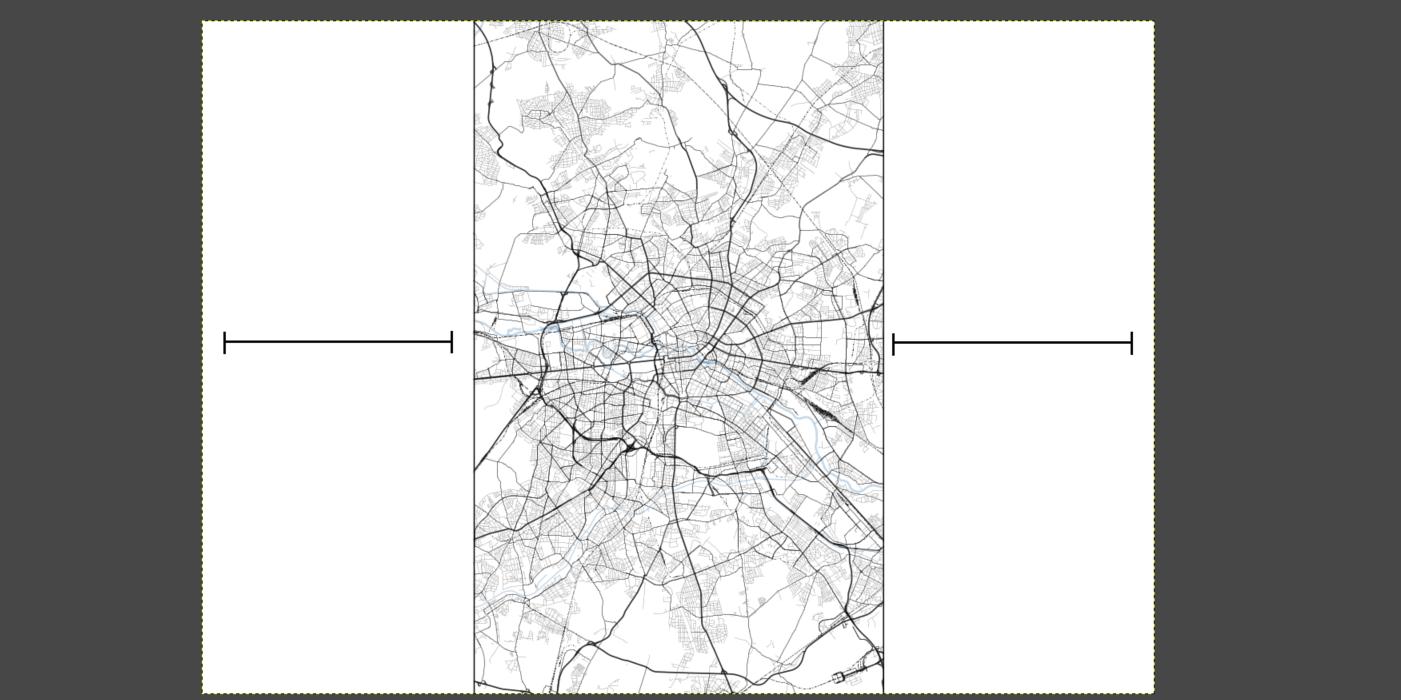
The function draw_map() allows you to customize your map so that it fits a poster-size pdf of your selection. To use the function, make sure you have the following R packages installed:
devtoolsggtextremotesShowtexttidyverse
Additionally, you will need the osmdata package. As mentioned on its repository, you can install the package directly from GitHub.
library(remotes)
remotes::install_github("ropensci/osmdata")
Once these packages are installed, you can source the function directly from my GitHub repository.
library(devtools)
source_url('https://raw.githubusercontent.com/moralescastillo/projects/master/func_draw_map.R')
By default, all posters are save on an A4 pdf with portrait orientation. You can also save the poster on sizes small (28 x 43 cm), medium (46 x 61 cm) and large (61 x 91 cm), or with custom dimensions. All pdfs are saved under the getwd() path.
Examples
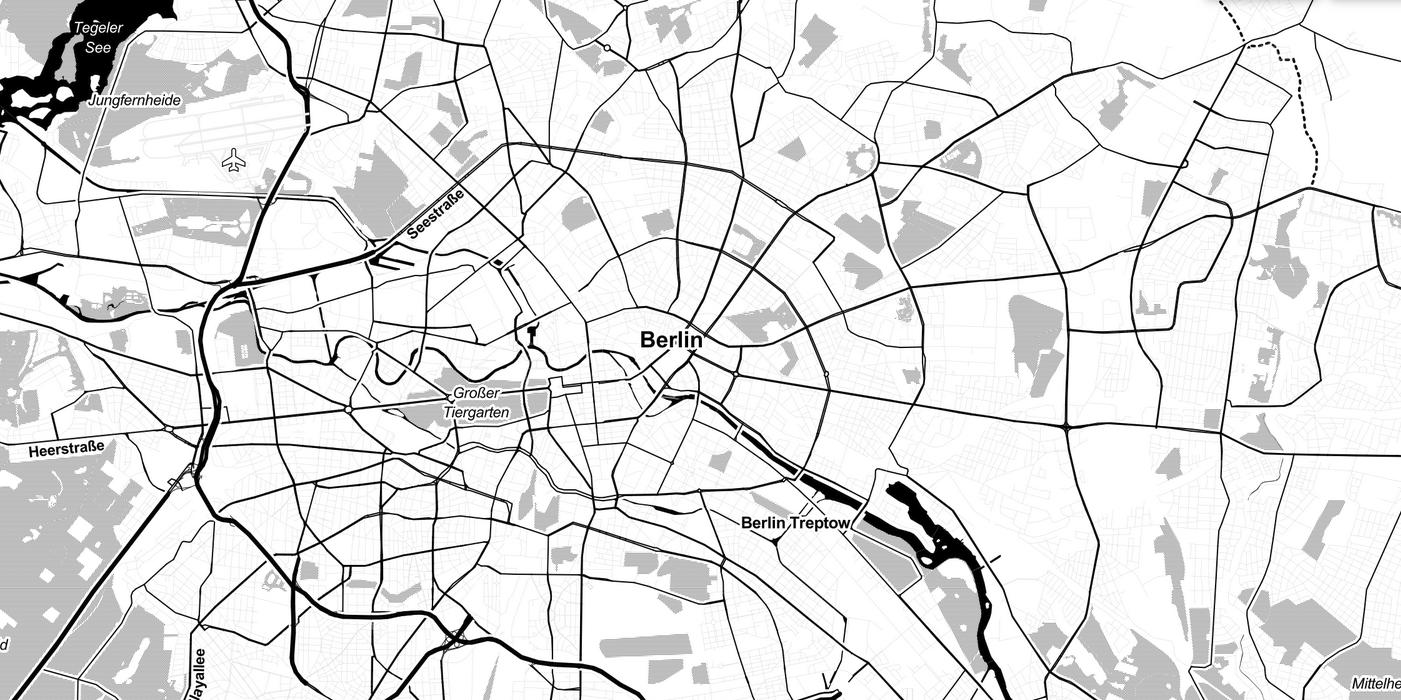
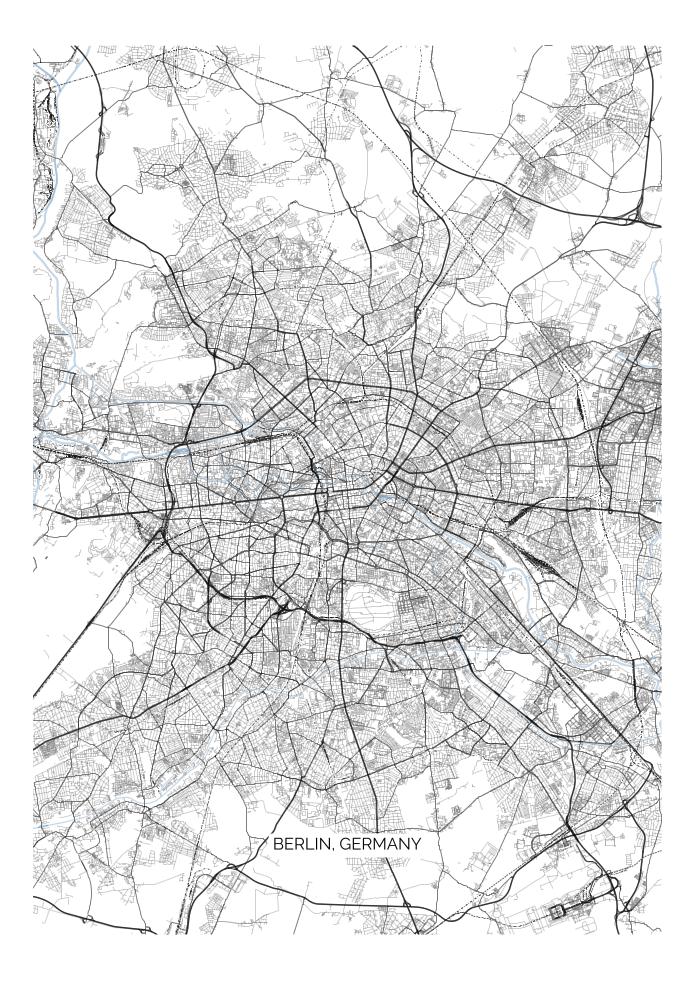
Create a pdf with the map of Berlin.
draw_map('Berlin, Germany') # add any location search term
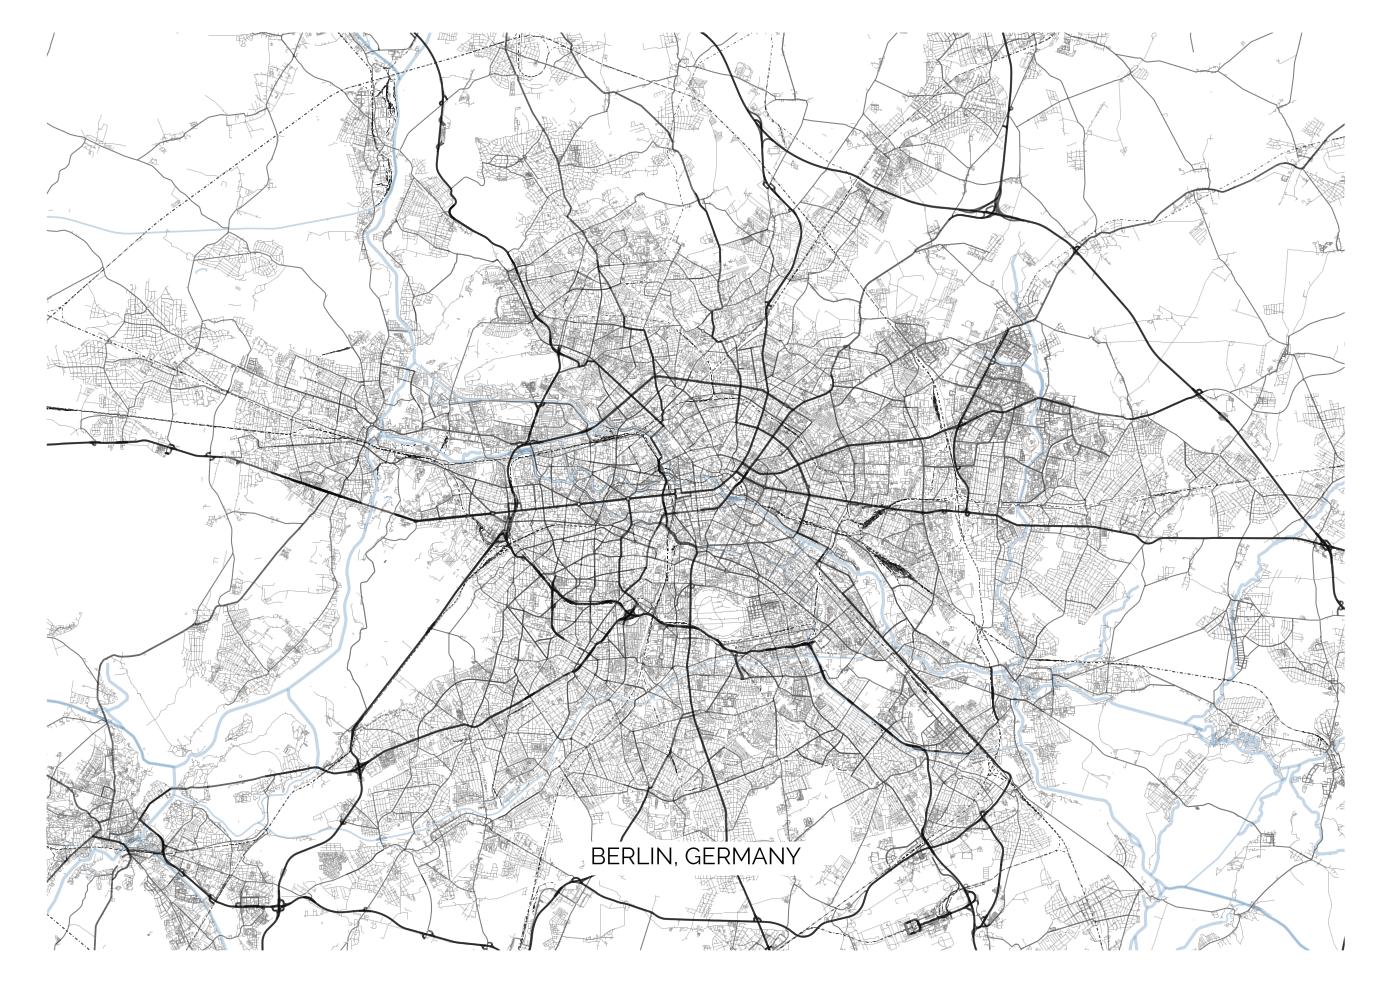
Create a pdf with the map of Berlin with landscape orientation.
draw_map('Berlin, Germany',
     orientation = 'landscape') # set orientation
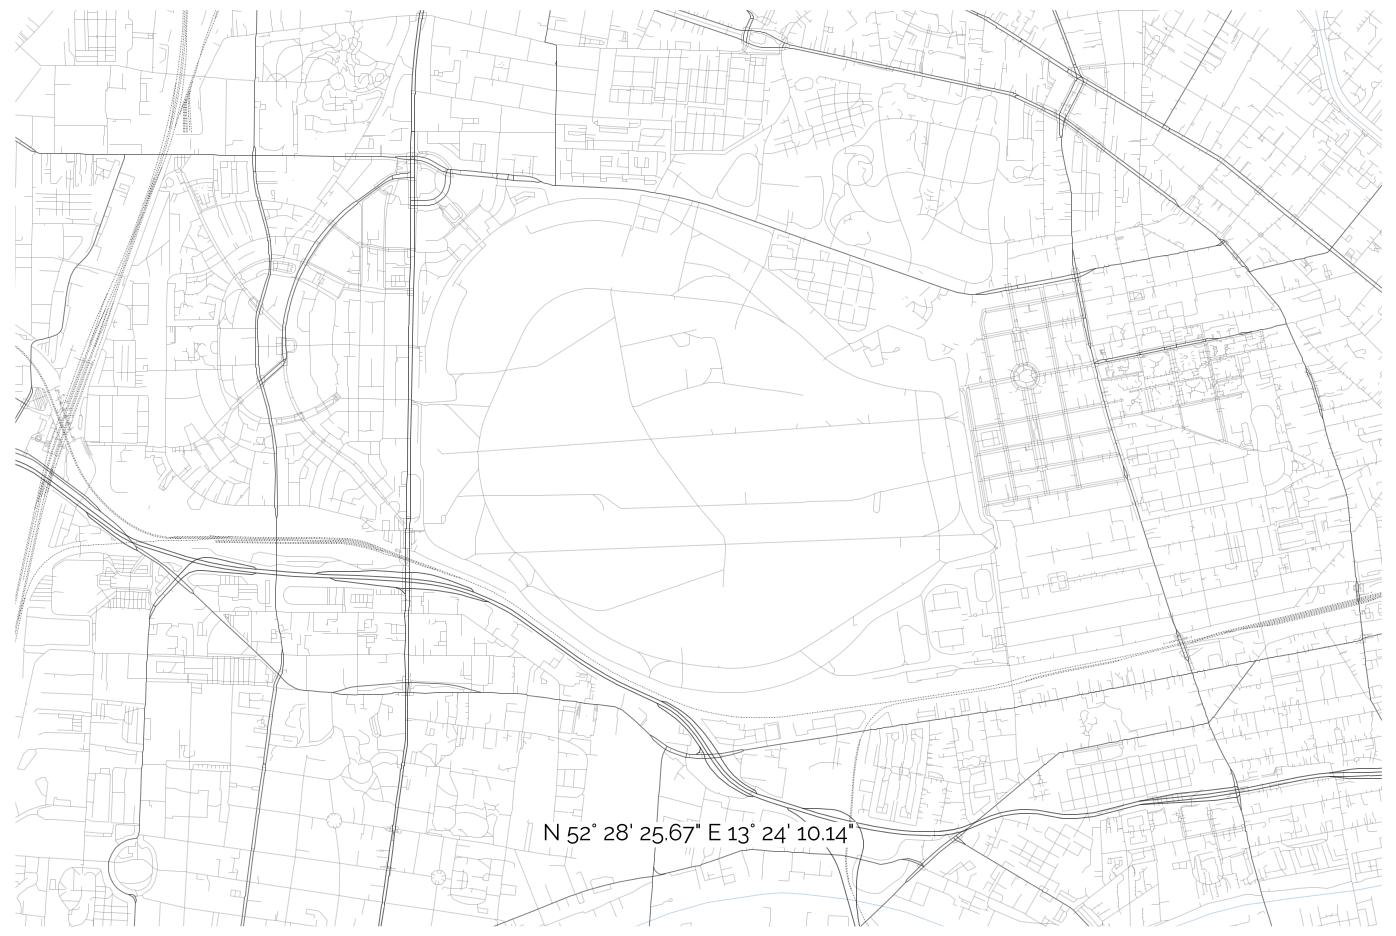
Create a map of Tempeholfer Feld covering 20 squared kilometes of surface, in a pdf of size large with landscape orientation.
draw_map(lat = 52.473796918438204, # lat of tempelhofer feld
		 lon = 13.402815871374086, # lon of tempelhofer feld
		 area = 20, # sq km
		 orientation = 'landscape',
		 page_size = 'l') # select A4, s, m, or l
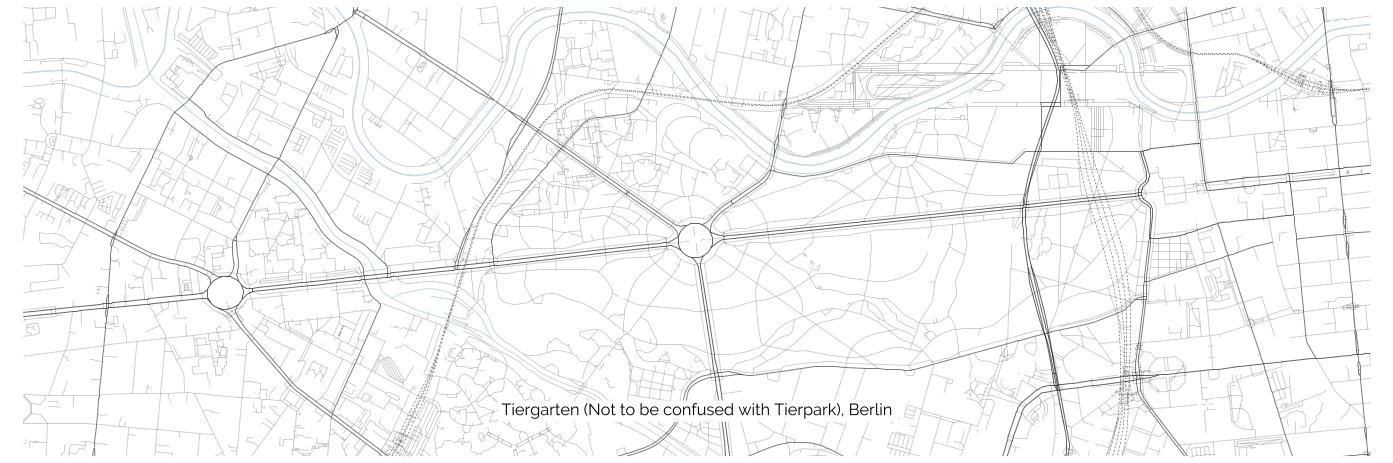
Create a map of Tiergarten Berlin covering 10 squared kms of surface, with custom label and pdf size.
draw_map(lat = 52.514846477000276, # lat of the Siegessäule
		 lon = 13.35018617281657, # lon of the Siegessäule
		 area = 10, #sq km
		 page_l = 20, # pdf length in cm
		 page_w = 60, # pdf width in cm
		 custom_label = 'Tiergarten (Not to be confused with Tierpark), Berlin')
There are common warning and errors that you can run into while using this code. For instance, depending the (surface) size of your map and your default setting in R, you may run out of memory to store the sf objects imported from OpenStreetMaps. Something along the lines of R Error: Cannot Allocate Vector of Size X GB. If such error arises, try to increase the current memory limit.
memory.limit(size=56000)
If there are features on the map that are missing (e.g. rivers or roads), you can modify the function to plot the map features that you need. You can read more about it here.


