


There is a plethora of fonts out there to make your plots more appealing to the eye. Thanks to the package showtext, you are able to use fonts from Google Fonts on your plots.
Remember that showtext does not work on RStudioGD. This implies that custom fonts will not show on your RStudio IDE. Instead, you can save the plot with the desired fonts in different supported formats.
Here is an example on how to use the font Lobster in a plot saved as a PNG image.
# load libraries
library(ggplot2)
library(showtext)

# add the font and turn showtext on automatically when using graphics
font_add_google('lobster')
showtext_auto()

# create plot with iris data
pp <-
  ggplot(iris, aes(x=Sepal.Length, y=Sepal.Width)) +
	geom_point(shape=1) +
	ggtitle('Here, some Iris data') +
	theme(text = element_text(family = 'lobster')) # set the font for plot

# call the plot
pp

# save the plot
ggsave("showtext-example.png", plot = pp, width = 7, height = 4, dpi = 96)
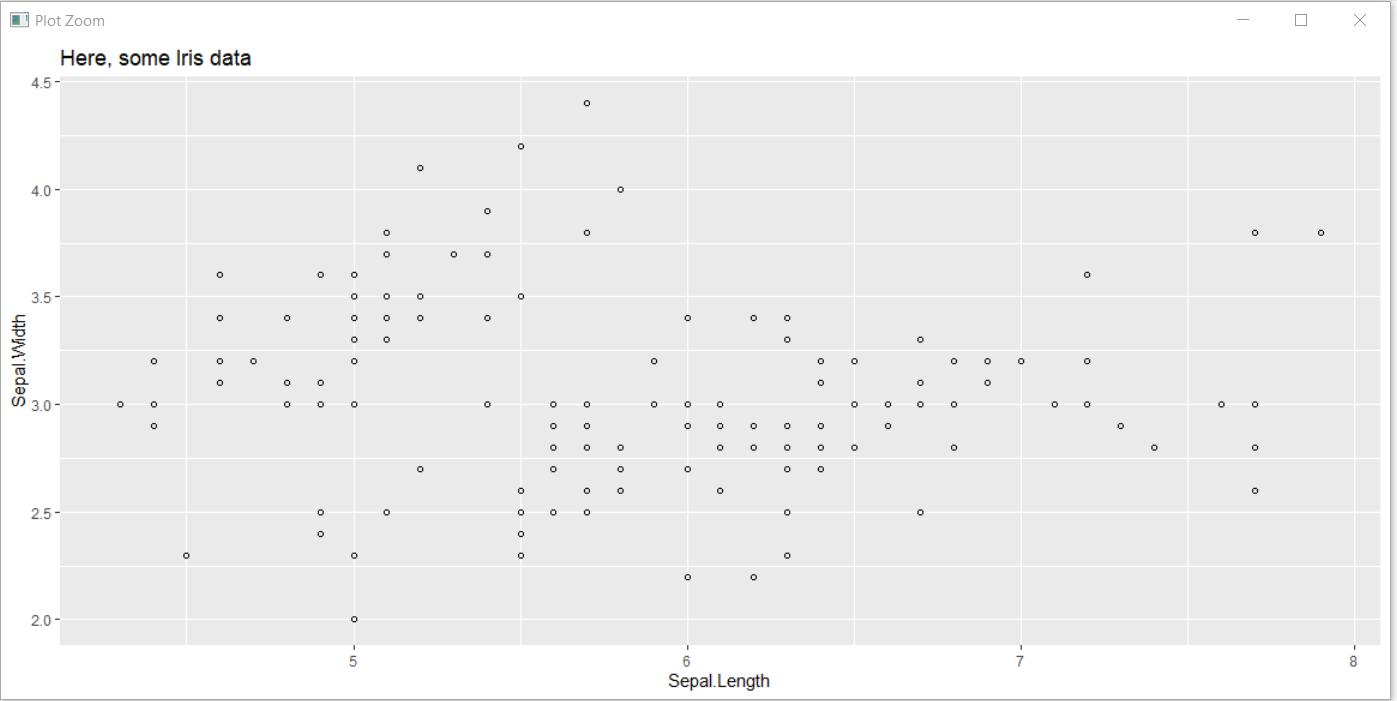
As mentioned, prompting the plot to appear in RStudio will show the default font.
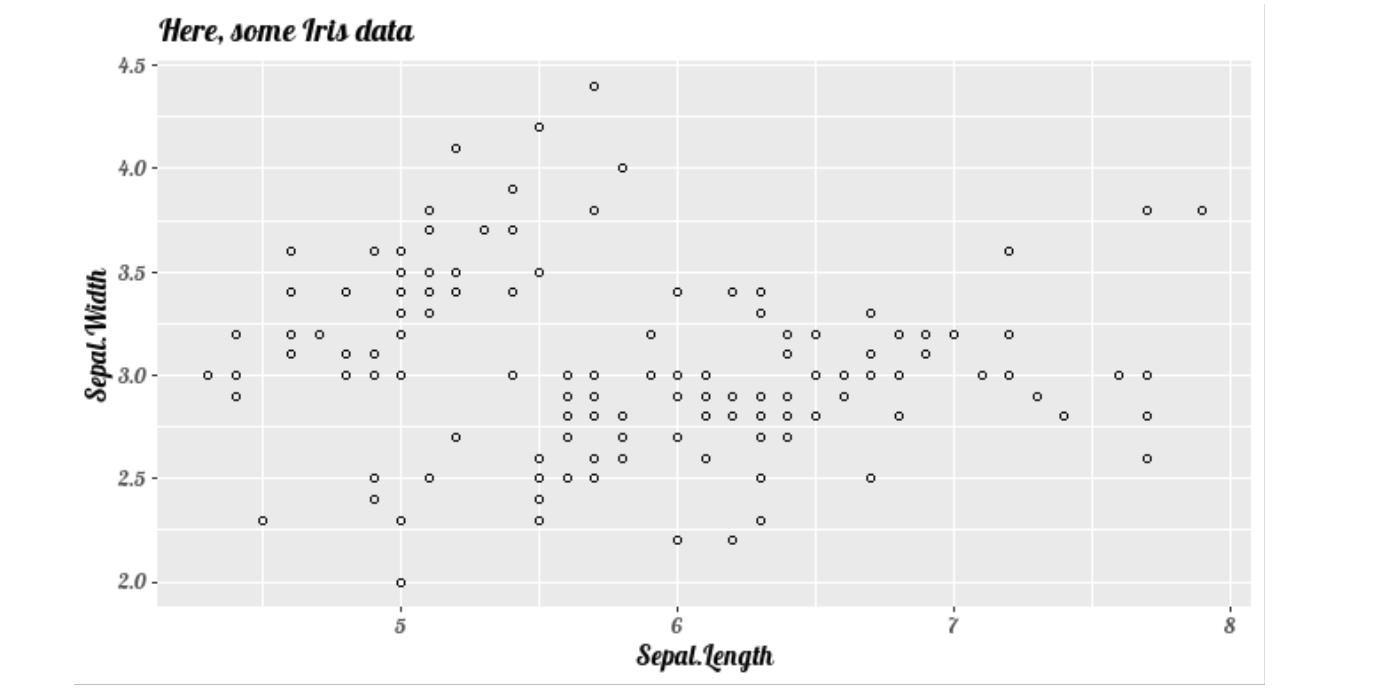
Yet, the saved file will have the desired outcome.
References:


