


One of Metabase’s best visualization options is maps. You include a table (dataset) with location-type columns and Metabase would plot the data on a map for you.
When first using the maps feature, I was disappointed to find out that mapping is limited to maps of the US or the whole world. Nothing else.
Thanks to one of my colleagues, I found out that custom maps are possible in Metabase. The only thing needed is the desired map’s GeoJSON file.
For instance, here is the GeoJSON file of Berlin containing coordinates of all of the city’s zip codes and their names.
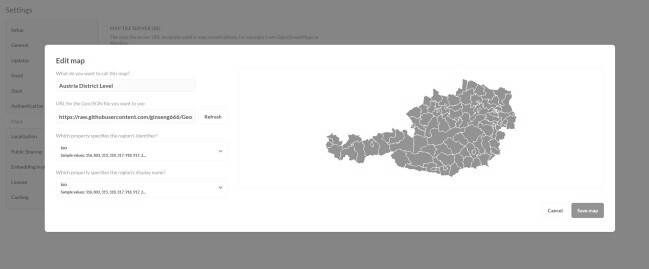
To include the GeoJSON file, visit your Metabase instance and click on Settings > Admin > Maps > Add a map. Add the raw GeoJSON file as a link, and click on Load. Additionally, give the map a name and region identifiers. Click on Add map.
After following these steps, your map will be available every time the Map visualization is selected in a new card. Here is an example of what the end result would look like in Metabase.

